Runs the CheckM lineage workflow to assess the genome quality of isolates, single cells, or genome bins from metagenome assemblies through comparison to an existing database of genomes.
This App runs the CheckM lineage workflow (lineage_wf) automatically on the provided data and produces a report. CheckM is part of the M-suite collection of bioinformatic tools from the Ecogenomics Group at the University of Queensland, Australia.
CheckM provides a set of tools for assessing the quality of genomes recovered from isolates, single cells, or metagenomes. It provides robust estimates of genome completeness and contamination by using collocated sets of genes that are ubiquitous and single-copy within a phylogenetic lineage. Assessment of genome quality can also be examined using plots depicting key genomic characteristics (e.g., GC, coding density) which highlight sequences outside the expected distributions of a typical genome. If you wish to make comments about the functional potential of a genome, look for maximum genome completeness and minimal contamination. Users should be aware that there are limitations to this approach. For a discussion of some of the assumptions of using a tool like CheckM see this article.
If your workflow involves metagenome assembled genomes (MAGs), then CheckM QC is likely one of the first things you will want to perform (i.e. prior to annotation of the AssemblySet). This information will indicate which genome bins should be discarded (i.e. rendered as unbinned) prior to analyses of the bins (e.g. Add Species to Genome Tree, Taxonomic Classification).
Input and Parameters:
Assembly, Genome, or BinnedContigs: A user may submit a single genome Assembly object, an AssemblySet, a Genome, a GenomeSet, or a BinnedContig object containing multiple "binned" genomes. For every input assemblies/genomes/bin, a separate evaluation of the genome completeness using the clade-specific phylogenetic marker genes will be performed.
Save all plots: The user has the option of generating and downloading all possible plots from the CheckM lineage workflow. Note that selecting this option will slow down the runtime (perhaps 10-20%).
Output:
Output Object: No output object is generated by CheckM lineage assessment. If you wish to filter a BinnedContigs object to obtain just the High Quality Bins, the Filter Bins by Quality with CheckM App does produce an output BinnedContigs object.
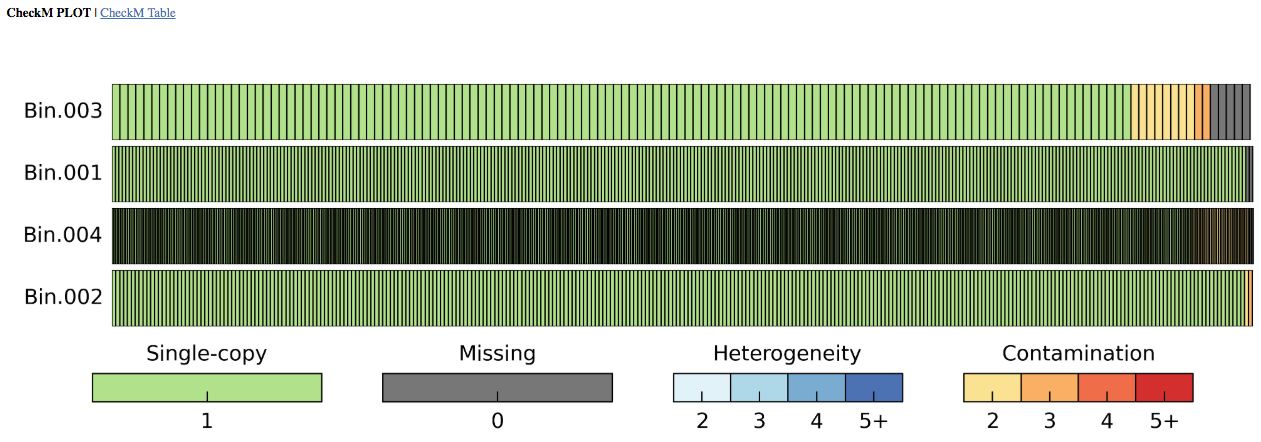
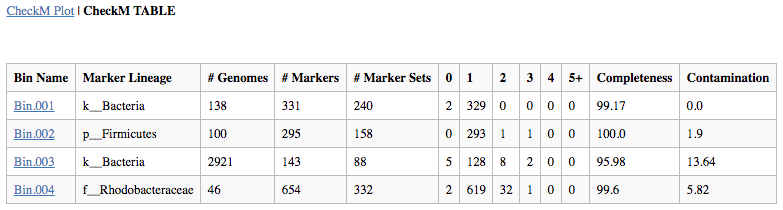
Output Report: The output report offers both graphical and tabular representations of the phylogenetic marker completeness and contamination. CheckM generates clade-specific marker gene sets for each bin and reports the taxonomic resolution possible for each bin in the "Marker Lineage" column. Users may want to look at the "Marker Lineage" column to see what MAGs were classified with, for example, the "d__Bacteria" or "d__Archaea" marker sets. Instances where a broad (domain-level) marker set is used compared to a marker set from specific lineage (e.g. c__Alphaproteobacteria) can help one contextualize (and evaluate) the genome completeness and contamination estimates.
The number of Genomes that were used in generating each marker set is given, as is the number of markers generated. Marker genes are typically single-copy, so the occurrence of more than one in a given genome or bin may reveal contamination, which is indicated with yellow to red bars in the graphical depiction and by the columns "2" to "5+" in the table. As noted above in the article on assumptions, for incomplete genomes (e.g. 50-70%) the contamination measure is going to be an underestimate. In other words, be wary of a genome that is 50% complete with 0% contamination - contamination is present, this tool just doesn't detect it.
The fraction of marker genes that occur as duplicates is used to calculate the "Contamination" percentage in the table. Missing clade-specific phylogenetic markers are shown in gray in the plot and by the column "0" in the table, with the "Completeness" value obtained by the proportion of the missing markers to the total number of markers used. The presence of one and exactly one copy of a marker is indicated with a green bar in the plot and the tally in the "1" column of the table. Ideally, a perfect Genome will have all markers in exactly one copy assuming that the derivation of the markers was itself perfectly done and biology was perfectly predictable. Be sure to inspect results to ensure they are accurate. For example, for lineages not well-characterized in the CheckM database, the CheckM program will produce dubious results because marker gene assumptions are broken.
Downloadable files: The plots and data output by the CheckM lineage workflow may be downloaded. Additionally, a Tab-delimited TSV table in zipped text format that contains the CheckM assessment summary (matching that in the HTML CheckM Table report) for each bin is available to download.
Team members who implemented App in KBase: Michael Sneddon and Dylan Chivian. For questions, please contact us.
Related Publications
- Parks DH, Imelfort M, Skennerton CT, Hugenholtz P, Tyson GW. CheckM: assessing the quality of microbial genomes recovered from isolates, single cells, and metagenomes. Genome Res. 2015;25: 1043 1055. doi:10.1101/gr.186072.114 , https://genome.cshlp.org/content/25/7/1043.long
- CheckM source: , http://ecogenomics.github.io/CheckM/
- Additional info: , https://github.com/Ecogenomics/CheckM/wiki
App Specification:
https://github.com/kbaseapps/kb_Msuite/tree/fae9ff521d21014413bb03e5fa080b4564218e9b/ui/narrative/methods/run_checkM_lineage_wfModule Commit: fae9ff521d21014413bb03e5fa080b4564218e9b