Generated November 10, 2022
figure1

Identifying a Novel degradation Pathway with KBase discovery pipeline and PDB tools

Narrative synopsis

  • In this Narrative workflow, we demonstrate the KBase discovery pipeline in identifying potential gene candidates on a novel Pyridine degradation pathway in Micrococcus luteus. Here (i) we use cheminformatics analysis to propose new biochemistry then, (ii) we use metabolic modeling and omics data to identify potential gene candidates, (iii)we then query the PDB to fetch metadata/annotations for experimentally resolved structures corresponding to the gene candidates. For these selected structures, later in this workshop, PDB team will demonstrate (iv) deriving co-crystallized structures with the substrates of interest that bolster the confidence of the identified gene candidates on this novel degradation pathway. Finally, the gene candidates can be experimentally verified.

  1. ) Annotate Mluteus genome using the RAST, Prokka and DRAM annotation pipelines 1a.) Explore the annotated genome
  2. ) Construct a Draft Metabolic Model/Metabolic network based on the functional annotations
  3. ) Generate network of hypothetical degradation reactions based on pyridine with Pickaxe
  4. ) Creating a Base Media for Gapfilling
  5. ) Filling knowledge gaps in the metabolic network - Gapfilling Metabolic Model 5a.) Creating a Pyridine Minimal Media for model simulation/ run Flux Balance Analysis (FBA)
  6. ) Running FBA on M.luteus against Pyridine Minimal Media aerobically
  7. ) Visualizing Noval Pyrdine degredation pathway and the fluxes in an Escher map
  8. ) Find potential gene candidates - Use differential expression analysis and gene clustering data to fliter highly expressed genes relavant to pyridine degredation 9.) Use of PDB structural evidence in identifying key steps of the pyridine degradation pathway 10.) Further investigate experimental structures that corresponds to candidate genes

Next, we follow another interesting example in the Arabidopsis riboflavin pathway on this narrative workflow that shows the value of applying computational tools in KBase and PDB to address important scientific questions.</p>

1. Annotate Mluteus genome using the RAST, Prokka and DRAM annotation pipelines

Here we annotate the Mluteus genome using three annotation pipelines which derive functional annoations for each gene in the genome. We annotate with three seperate algorithms which increase the chances of assigning functions for maximum number of genes in the genome

figure1

1a. Explore the Annotated Genome

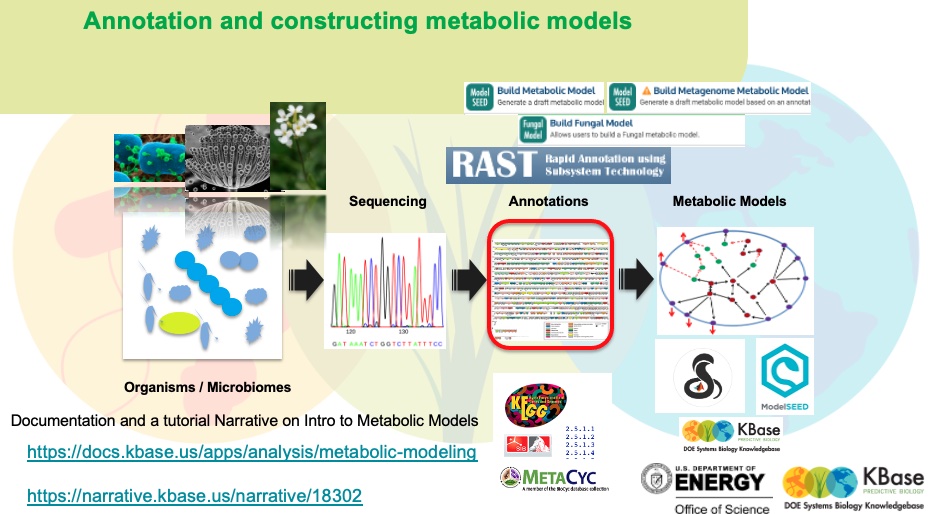
Below, the M.luteus genome is shown in a genome viewer. This viewer provides a concise, text-based overview of the genome as well as its contigs and genes.

In the Contigs and Features tabs, each entry is clickable, opening either a browser for the contig or another tab with expanded information about the gene. You can sort these entries by clicking on a column header to sort by that field (e.g., Length). Clicking the same column header again will reverse the sort order.

The M.luteus genome has two contigs. Click on one to see neighboring genes and potential operons in this species.

To further explore this genome, click on "Browse Features" tab, where you can search for gene annotations/functions by name (e.g; pyruvate synthase, EC numbers etc.), extract DNA or protein sequences, explore the neigboring genes/gene clusters

v2 - KBaseGenomes.Genome-10.0
The viewer for the data in this Cell is available at the original Narrative here: https://narrative.kbase.us/narrative/127880
Annotate MAGs with DRAM and distill resulting annotations to create an interactive functional summary per genome. For KBase genome objects.
This app completed without errors in 25m 6s.
Summary
Here are the results from your DRAM run.
Links
Files
These are only available in the live Narrative: https://narrative.kbase.us/narrative/127880
  • annotations.tsv - DRAM annotations in a tab separate table format
  • genes.faa - Genes as amino acids predicted by DRAM with brief annotations
  • product.tsv - DRAM product in tabular format
  • metabolism_summary.xlsx - DRAM metabolism summary tables
  • genome_stats.tsv - DRAM genome statistics table
Annotate Assembly and Re-annotate Genomes with Prokka annotation pipeline.
This app completed without errors in 4m 28s.
Objects
Created Object Name Type Description
Mluteus_ATCC_49442_RAST_PROKKA Genome Annotated genome
Summary
Genome Ref:127880/33/1 Number of features sent into prokka:4702 New functions found:2260 Ontology terms found:1123
Files
These are only available in the live Narrative: https://narrative.kbase.us/narrative/127880
  • function_report - Annotation report generated by kb_prokka
  • ontology_report - Annotation report generated by kb_prokka
Output from Annotate Assembly and Re-annotate Genomes with Prokka - v1.14.5
The viewer for the output created by this App is available at the original Narrative here: https://narrative.kbase.us/narrative/127880

2. Construct a Draft Metabolic Model/Metabolic network based on the functional annotations

We use our M.luteus genome previoulsy assembled and annotated with multiple annotation algorithms for draft metabolic modeling reconstruction.

Reference tutorial narrative on Metabolic Model Construction

figure1
Construct a draft metabolic model based on an annotated genome.
This app completed without errors in 1m 37s.
Objects
Created Object Name Type Description
DraftModel_Mluteus FBAModel FBAModel-14 DraftModel_Mluteus
DraftModel_Mluteus.gf.1 FBA FBA-13 DraftModel_Mluteus.gf.1
Report
Summary
RefGlucoseMinimal media.
Output from Build Metabolic Model
The viewer for the output created by this App is available at the original Narrative here: https://narrative.kbase.us/narrative/127880

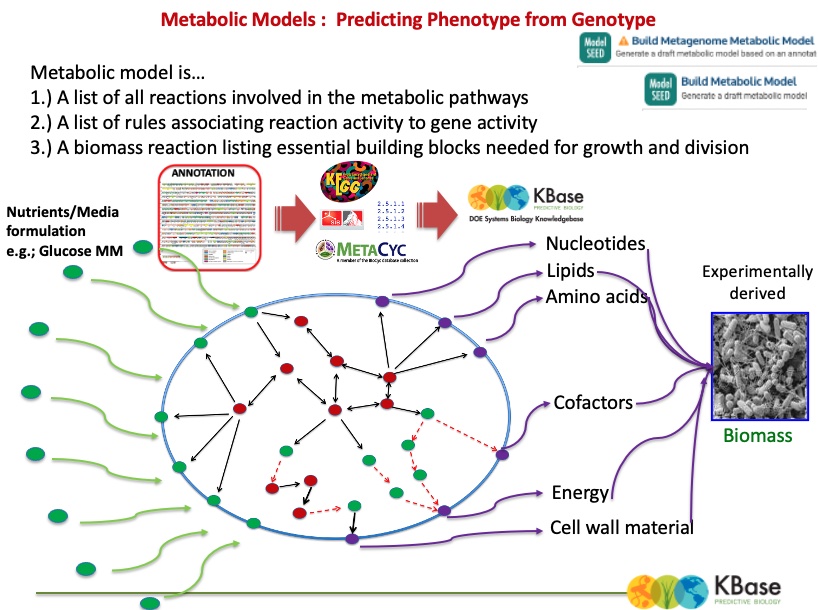
The output (above) of the Build Metabolic Model app shows information about the resulting gapfilled model. (Note that although the object type is “FBA Model,” we have not actually performed a flux balance analysis yet.)

There are eight tabs for browsing the data in the model: Overview, Reactions, Compounds, Genes, Compartments, Biomass, Gapfilling, and Pathways.

  • Overview — Summary of key information about the model, including the associated genome, number of reactions, and number of compounds.
  • Reactions — Detailed reaction information, including reaction ID, name, biochemical equation, the associated gene IDs, and whether or not the reaction was added by the gapfilling stage.
  • Compounds — Information about compounds in the model, including chemical formula and charge.
  • Genes — Gene IDs and associated reaction IDs.
  • Compartments — Subcellular localization of the compounds and enzymes. Typically, there are three types of compartments in microbes: Cytosol (c), -Periplasm (p), and Extracellular (e). Reactions and compounds belonging to each compartment are identified using compartment notation (e.g., rxn00001[c0], cpd00001[c0]). The integer associated with the compartment (e.g., the 0 in c0) represents the index number of the model. For a single-species model, this number will always be zero, but if individual models are merged into a community model, each sub-model will then be assigned a distinct index.
  • Biomass — Biomass composition of the model. Typically biomass is represented in the model as an equation where biomass compounds and ATP would make 1 gram of biomass. After clicking on the Biomass tab, the coefficients of each biomass component are listed in the Coefficient column. Negative coefficients represent the compounds on the left side of the biomass equation, and positive coefficients represent the compounds on the right side of the equation.
  • Gapfilling — Reactions that were added to fill metabolic gaps resulting from missing or inconsistent annotations. During the gapfilling process, an optimization algorithm adds a minimal number of reactions and compounds to make the biochemical network generate biomass. Currently, this tab does not show anything because gapfilling indiciation was moved to the Reactions tab.
  • Pathways — KEGG maps that represent the metabolic network of the model. Click on the name of a map (e.g., TCA cycle) to see the presence or absence of the reactions (blue).

3. Generate network of hypothetical degradation reactions based on Pyridine with Pickaxe

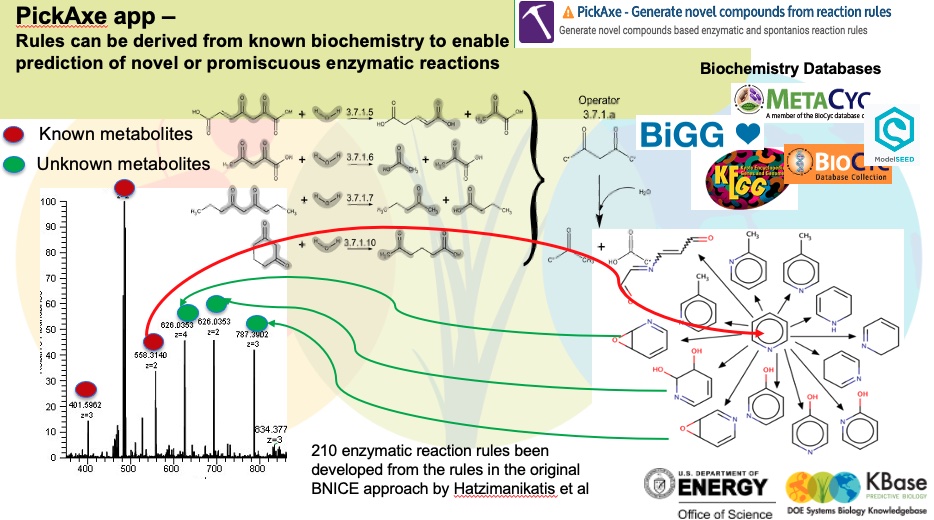
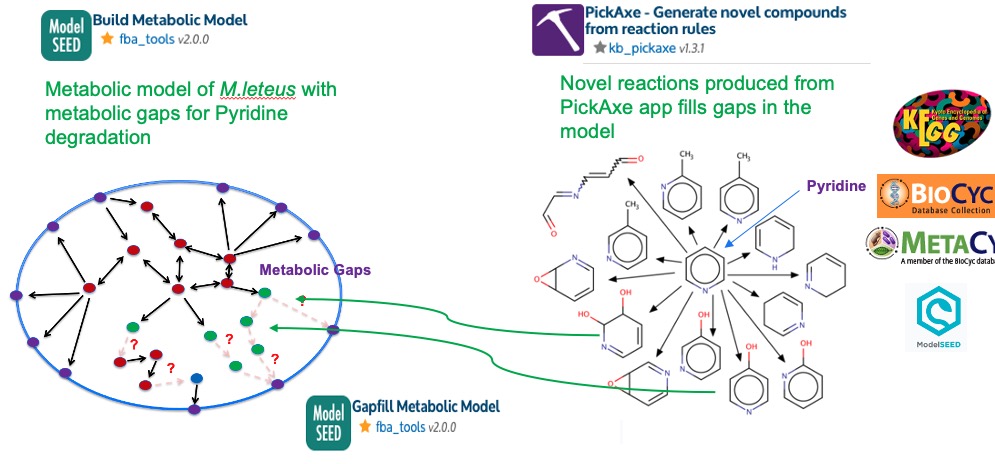
To generate some potential utilization routes for pyridine, we use Pickaxe app. This tool uses a set of general reaction rules which are curated from known biochemistry as the figure below demonstrates. These reactions can be applied to novel substrates like pyridine to propose new chemical transformations.

figure1
Generate novel compounds based enzymatic and spontanios reaction rules
This app completed without errors in 3m 56s.
Objects
Created Object Name Type Description
PyridineNovelReactions FBAModel FBAModel-14 PyridineNovelReactions
Report
v2 - KBaseFBA.FBAModel-14.0
The viewer for the data in this Cell is available at the original Narrative here: https://narrative.kbase.us/narrative/127880

4. Creating a Base Media for Gapfilling

You can construct any custom media with the Edit Media app. Here we use an existing media formulation (e.g; Glucose Minimal Media) that we can copy from our reference media and remove Glucose,the sole carbon source from the media creating a base media base media that have all necessary salts, Oxygen, Nitrogen, Sulfur, Phosphate except for the carbon source. We discuss having Pyridine as the carbon source in the following step of Gapfill Metabolic Model step (Filling knowledge gaps in the metabolic network - Gapfilling Metabolic Model).

Curate/edit an existing media formulation.
This app completed without errors in 28s.
Objects
Created Object Name Type Description
BaseMedia Media Media-4 BaseMedia
Report
Summary
1 compounds removed from the media: cpd00027. No compounds changed in the media. No compounds added to the media.
Output from Edit Media
The viewer for the output created by this App is available at the original Narrative here: https://narrative.kbase.us/narrative/127880

5. Filling knowledge gaps in the metabolic network - Gapfilling Metabolic Model

Typically, draft metabolic models tend to have metabolic gaps due to missing or incomplete annotations. In this workflow, the metaboic gap that we are interested is the Pyridine degredation as the pathway is not chracterized. We have used the PickAxe app above to generate potential noval reactions and pathways for pyridine degration. Now, in next step we use the PickAxe output (Selected under Source Gapfill Model) to fill the pyridine degredation gap in the M.luteus metabolic model.

As for the Media, we use a base media that have all necessary salts, Oxygen, Nitrogen, Sulfur, Phosphate - (Selected under Media) and the sole carbon source Pyridine will be selected under Source model media supplement option.

figure1
Identify the minimal set of biochemical reactions to add to a draft metabolic model to enable it to produce biomass in a specified media.
This app completed without errors in 2m 32s.
Objects
Created Object Name Type Description
DraftModel_MLuteus.pyridine.gf FBAModel FBAModel-14 DraftModel_MLuteus.pyridine.gf
DraftModel_MLuteus.pyridine.gf.gf.2 FBA FBA-13 DraftModel_MLuteus.pyridine.gf.gf.2
Report
Output from Gapfill Metabolic Model
The viewer for the output created by this App is available at the original Narrative here: https://narrative.kbase.us/narrative/127880

There are eight tabs for browsing the data (above) in the model: Overview, Reactions, Compounds, Genes, Compartments, Biomass, Gapfilling, and Pathways.

  • Overview — Summary of key information about the model, including the associated genome, number of reactions, and number of compounds.
  • Reactions — Detailed reaction information, including reaction ID, name, biochemical equation, the associated gene IDs, and whether or not the reaction was added by the gapfilling stage.
  • Compounds — Information about compounds in the model, including chemical formula and charge.
  • Genes — Gene IDs and associated reaction IDs. In a typical genome-scale model output table genes tab is populated, however, for metagenome models, given that there are extremly large number of genes affecting the efficient loading and browsing of the table, we do not display the genes.
  • Compartments — Subcellular localization of the compounds and enzymes. Typically, there are three types of compartments in microbes: Cytosol (c), -Periplasm (p), and Extracellular (e). Reactions and compounds belonging to each compartment are identified using compartment notation (e.g., rxn00001[c0], cpd00001[c0]). The integer associated with the compartment (e.g., the 0 in c0) represents the index number of the model. For a single-species model, this number will always be zero, but if individual models are merged into a community model, each sub-model will then be assigned a distinct index.
  • Biomass — Biomass composition of the model. Typically biomass is represented in the model as an equation where biomass compounds and ATP would make 1 gram of biomass. After clicking on the Biomass tab, the coefficients of each biomass component are listed in the Coefficient column. Negative coefficients represent the compounds on the left side of the biomass equation, and positive coefficients represent the compounds on the right side of the equation.
  • Gapfilling — Reactions that were added to fill metabolic gaps resulting from missing or inconsistent annotations. During the gapfilling process, an optimization algorithm adds a minimal number of reactions and compounds to make the biochemical network generate biomass. Currently, this tab does not show anything because gapfilling indiciation was moved to the Reactions tab. Pathways — KEGG maps that represent the metabolic network of the model. Click on the name of a map (e.g., TCA cycle) to see the presence or absence of the reactions (blue).

5a. Creating a Pyridine Minimal Media for model simulation/ run Flux Balance Analysis (FBA)

In order to simulate metabolic moodels (to run FBA), we need a media formulation. In this work flow we use the custom media formulation Pyridine Minimal media. You can construct any custom media with the app Edit Media. Here we use an existing media formulation (e.g; Glucose Minimal Media) that we can copy from our reference media and replace with Pyridine creating Pyridine minimal media.

Output from Edit Media
The viewer for the output created by this App is available at the original Narrative here: https://narrative.kbase.us/narrative/127880
Curate/edit an existing media formulation.
This app completed without errors in 29s.
Objects
Created Object Name Type Description
PyridineMinimalMedia Media Media-4 PyridineMinimalMedia
Report
Summary
1 compounds removed from the media: cpd00027. No compounds changed in the media. 1 compounds added to the media: cpd00556.

6. Running FBA on M.luteus against Pyridine Minimal Media aerobically

Now we are going to run flux balance analysis on one of the bins (genome-scale model), which will simulate how this would grow on Pyridine-minimal media.

Useful articles on Flux Balance Analysis and Flux Variability Analysis

What is FBA - https://www.ncbi.nlm.nih.gov/pmc/articles/PMC3108565/

Flux Variability Analysis (FVA) - https://www.ncbi.nlm.nih.gov/pubmed/14642354

Reaction classifiers are assigned when using Flux Variability Analysis, FVA. In FVA, the global objective (biomass) is fixed at its optimal value, then each reaction, iteratively, is optimized independently to find both the maximal and minimal value that is possible given that the global objective must still be reached. FVA analysis composed into four categories in the following FBA. (See the column "class" in the FBA output data)

  • Variable – the reaction has positive maximal and negative minimal values, meaning that it can go in either direction.
  • Positive variable – the reaction has a positive maximal, and a zero minimal, meaning that it can either be zero, or it can go from left to right.
  • Negative variable – the reaction has a zero maximal, and a negative minimal, meaning it can either be zero, or it can go from right to left.
  • Blocked – the reaction is blocked and cannot have a non-zero value.
Predict metabolite fluxes in a metabolic model of an organism grown on a given media using flux balance analysis (FBA).
This app completed without errors in 32s.
Objects
Created Object Name Type Description
FBA_Mlutues_Pyridine_Degradation FBA FBA-13 FBA_Mlutues_Pyridine_Degradation
Report
Summary
A flux balance analysis (FBA) was performed on the metabolic model 127880/50/1 growing in 127880/21/9 media.
Output from Run Flux Balance Analysis
The viewer for the output created by this App is available at the original Narrative here: https://narrative.kbase.us/narrative/127880

When the FBA analysis finishes, information on the flux distribution is displayed in a table with six tabs: Overview, Reaction fluxes, Exchange fluxes, Genes, Biomass, and Pathways (see above).

  • Overview — Among the summary information in this tab is the objective value (growth of the model), which is important because it represents the maximum achievable flux through the biomass reaction of the metabolic model. An objective value of 0 or a value very close to 0 means that the model did not grow on the specified media. This tab also lists other information, including the genome, media formulation, number of reactions, and number of compounds associated with the FBA.
  • Reaction fluxes — Numerical flux values, minimum and maximum flux bounds, biochemical equations, and associated genes for each reaction in the model. This information represents the fluxes through all internal reactions that allow for growth and byproduct creation. These fluxes can be further broken down into biological pathways of interest (see Pathways tab). A user may ask, for example, “what compounds consumed or excreted?” or “What are the high flux reactions or pathways?”
  • Exchange fluxes — These fluxes describe the rates at which nutrients are taken in and byproducts are secreted. Positive exchange flux values represent the uptake of compounds, and negative exchange flux values represent the excretion of compounds.
  • Genes — This tab displays the gene knockout information, if any.

  • Biomass — Biomass composition of the model is displayed. Typically, biomass is represented in the model as an equation where biomass compounds and ATP would make 1 gram of biomass. After clicking on the Biomass tab, the coefficients of each biomass component are listed in the Coefficient column. Negative coefficients represent the compounds on the left side of the biomass equation, and positive coefficients represent the compounds on the right side of the equation.

  • Pathways — This tab displays KEGG maps that represent the metabolic network of the model. Click on the name of a map (e.g., TCA cycle) to see the presence or absence of reactions (blue) and fluxes (positive fluxes are shades of red; negative fluxes are shades of green).

7. Visualizing Pyrdine degredation pathway and the fluxes in an Escher map

Display Metabolic Pathways
This app completed without errors in 36s.
Summary
message_in_app /kb/module/work/tmp/6c39f79c-1bf6-4c33-b613-e036f4d14c64
Links

Identifying potential gene candidates for the pyridine degradation

8. Use differential expression analysis (Glucose vs Pyridine) and gene clustering data to fliter highly expressed genes relevant to pyridine degredation

Now we have demonstrated a potential novel pathway for pyridine degredation, next, we can work on identifying the potential gene candidates. From the gapfilling and FBA steps, we can see the novel pyridine degradation reactions are associated with partial EC number 1.14.13 -. In our genome, there are about 30 genes are assigned with the first three digits of the EC number 1.14.13. We use the (i) differential expression data to filter out highly expressed genes (green) and (ii) the gene clustering data. Differential Expression analysis Narrative can be found here.

figure1
v2 - KBaseGenomes.Genome-11.0
The viewer for the data in this Cell is available at the original Narrative here: https://narrative.kbase.us/narrative/127880

9. Use of PDB structural evidence in identifying key steps of the pyridine degradation pathway

The PDB annotation app (below) fetch any available structural data evidence in PDB that are homologous to genes in the M.luteus genome

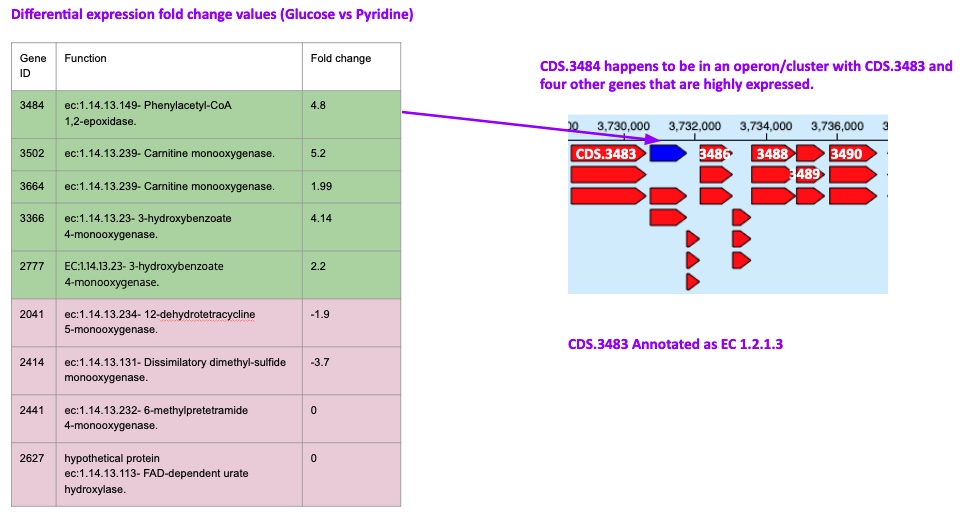
While the highly expressed genes with EC 1.14.13 narrow down the list of gene candidates, the gene clustering data/neighboring genes in the same operon provide valuable insights on key enzymatic steps of the degradation pathway. By surveying the gene cluster/neibouring genes with the MLuteus_masurca_RAST.CDS.3484 against PDB structural evidence, we can find the MLuteus_masurca_RAST.CDS.3483 gene, a phenylacetate dehydrogenase (paaZ) linked to a literature explaining the key step of ring opening enzyme on phenylacetate, a substrate that is chemically similar to pyridine.

Queries PDB API with genome proteins and annotates proteins with associated PDB metadata
This app completed without errors in 1h 24m 12s.
Objects
Created Object Name Type Description
Mluteus_ATCC_49442_RAST_PROKKA.pdb Genome Saving PDB annotation for Mluteus_ATCC_49442_RAST_PROKKA
Links
v2 - KBaseGenomes.Genome-11.0
The viewer for the data in this Cell is available at the original Narrative here: https://narrative.kbase.us/narrative/127880

10. Further investigate experimental structures that corresponds to candidate genes

Here we can query experimentally resolved structures that are corresponding to the potential gene candidates

Tune in for:

  • Query and learn from co-crystalized structures with the docking of the substrate

  • Align experimental and computational structures to aid binding site identification and functional characterization

Given a json format query constraint, query RCSB databases for a list of protein structures
This app completed without errors in 30s.
Summary
Query has resulted in 4 structures in RCSB DB.
Links

Released Apps

  1. Annotate Assembly and Re-annotate Genomes with Prokka - v1.14.5
    • Seemann T. Prokka: rapid prokaryotic genome annotation. Bioinformatics. 2014;30: 2068 2069. doi:10.1093/bioinformatics/btu153
  2. Build Metabolic Model
    • [1] Henry CS, DeJongh M, Best AA, Frybarger PM, Linsay B, Stevens RL. High-throughput generation, optimization and analysis of genome-scale metabolic models. Nat Biotechnol. 2010;28: 977 982. doi:10.1038/nbt.1672
    • [2] Overbeek R, Olson R, Pusch GD, Olsen GJ, Davis JJ, Disz T, et al. The SEED and the Rapid Annotation of microbial genomes using Subsystems Technology (RAST). Nucleic Acids Res. 2014;42: D206 D214. doi:10.1093/nar/gkt1226
    • [3] Latendresse M. Efficiently gap-filling reaction networks. BMC Bioinformatics. 2014;15: 225. doi:10.1186/1471-2105-15-225
    • [4] Dreyfuss JM, Zucker JD, Hood HM, Ocasio LR, Sachs MS, Galagan JE. Reconstruction and Validation of a Genome-Scale Metabolic Model for the Filamentous Fungus Neurospora crassa Using FARM. PLOS Computational Biology. 2013;9: e1003126. doi:10.1371/journal.pcbi.1003126
    • [5] Mahadevan R, Schilling CH. The effects of alternate optimal solutions in constraint-based genome-scale metabolic models. Metab Eng. 2003;5: 264 276.
  3. Edit Media
    • Arkin AP, Cottingham RW, Henry CS, Harris NL, Stevens RL, Maslov S, et al. KBase: The United States Department of Energy Systems Biology Knowledgebase. Nature Biotechnology. 2018;36: 566. doi: 10.1038/nbt.4163
  4. Run Flux Balance Analysis
    • Henry CS, DeJongh M, Best AA, Frybarger PM, Linsay B, Stevens RL. High-throughput generation, optimization and analysis of genome-scale metabolic models. Nat Biotechnol. 2010;28: 977 982. doi:10.1038/nbt.1672
    • Orth JD, Thiele I, Palsson B . What is flux balance analysis? Nature Biotechnology. 2010;28: 245 248. doi:10.1038/nbt.1614

Apps in Beta

  1. Annotate and Distill Genomes with DRAM
    • DRAM source code
    • DRAM documentation
    • DRAM publication
  2. Edit Media
    • Arkin AP, Cottingham RW, Henry CS, Harris NL, Stevens RL, Maslov S, et al. KBase: The United States Department of Energy Systems Biology Knowledgebase. Nature Biotechnology. 2018;36: 566. doi: 10.1038/nbt.4163
  3. Escher Pathway Viewer
    • [1] King, Z. A., Dr ger, A., Ebrahim, A., Sonnenschein, N., Lewis, N. E., & Palsson, B. . (2015). Escher: A Web Application for Building, Sharing, and Embedding Data-Rich Visualizations of Biological Pathways. PLOS Computational Biology, 11(8), e1004321.
    • [2] Rowe, E., Palsson, B. ., & King, Z. A. (2018). Escher-FBA: a web application for interactive flux balance analysis. BMC Systems Biology, 12(1), 84.
  4. Gapfill Metabolic Model
    • [1] Henry CS, DeJongh M, Best AA, Frybarger PM, Linsay B, Stevens RL. High-throughput generation, optimization and analysis of genome-scale metabolic models. Nat Biotechnol. 2010;28: 977 982. doi:10.1038/nbt.1672
    • [2] Henry CS, Jankowski MD, Broadbelt LJ, Hatzimanikatis V. Genome-Scale Thermodynamic Analysis of Escherichia coli Metabolism. Biophysical Journal. 2006;90: 1453 1461. doi:10.1529/biophysj.105.071720
    • [3] Jankowski MD, Henry CS, Broadbelt LJ, Hatzimanikatis V. Group Contribution Method for Thermodynamic Analysis of Complex Metabolic Networks. Biophysical Journal. 2008;95: 1487 1499. doi:10.1529/biophysj.107.124784
    • [4] Henry CS, Zinner JF, Cohoon MP, Stevens RL. iBsu1103: a new genome-scale metabolic model of Bacillus subtilisbased on SEED annotations. Genome Biology. 2009;10: R69. doi:10.1186/gb-2009-10-6-r69
    • [5] Orth JD, Thiele I, Palsson B . What is flux balance analysis? Nature Biotechnology. 2010;28: 245 248. doi:10.1038/nbt.1614
    • [6] Latendresse M. Efficiently gap-filling reaction networks. BMC Bioinformatics. 2014;15: 225. doi:10.1186/1471-2105-15-225
    • [7] Dreyfuss JM, Zucker JD, Hood HM, Ocasio LR, Sachs MS, Galagan JE. Reconstruction and Validation of a Genome-Scale Metabolic Model for the Filamentous Fungus Neurospora crassa Using FARM. PLOS Computational Biology. 2013;9: e1003126. doi:10.1371/journal.pcbi.1003126
  5. PDB - Import PDB Metadata into KBase Genome
    no citations
  6. PickAxe - Generate novel compounds from reaction rules
    • 'J. Jeffryes, R. Colestani, M. El-Badawi, T. Kind... C. Henry MINEs: Open access databases of computationally predicted enzyme promiscuity products for untargeted metabolomics J. Cheminformatics 7:44 (2015)'
    • 'C.Lerma-Ortiz, J.Jeffryes, A.Cooper...C.Henry & A.Hanson Nothing of chemistry disappears in biology : The Top 30 damage-prone metabolites Biochem. Soc. Trans. 44, 961-71 (2016)'
  7. Query RCSB databases for protein structures
    no citations