Generated February 24, 2020
![]()
* Corresponding author: CSH (chenry@mcs.anl.gov)
Automatically generated bacterial metabolic models, and even some curated models, lack accuracy in predicting energy yields due to poor representation of key pathways in energy biosynthesis and the electron transport chain (ETC). Further compounding the problem, complex interlinking pathways in genome-scale metabolic models, and the need for extensive gapfilling to support complex biomass reactions, often results in predicting unrealistic yields or unrealistic physiological flux profiles
To overcome this challenge, we developed methods and tools (used in this Narrative) to build high quality core metabolic models (CMM) representing accurate energy biosynthesis based on a well studied, phylogenetically diverse set of model organisms. We compare these models to explore the variability of core pathways across all microbial life, and by analyzing the ability of our core models to synthesize ATP and essential biomass precursors, we evaluate the extent to which the core metabolic pathways and functional ETCs are known for all microbes. 6,600 (80%) of our models were found to have some type of aerobic ETC, whereas 5,100 (62%) have an anaerobic ETC, and 1,279 (15%) do not have any ETC. Using our manually curated ETC and energy biosynthesis pathways with no gapfilling at all, we predict accurate ATP yields for nearly 5586 (70%) of the models under aerobic and anaerobic growth conditions.
| Glucose-aerobic | Glucose-anaerobic | Glucose-anaerobic-Nitrate |
Glucose-anaerobic-DMSO | Glucose-anaerobic-TMAO | Glycerol-anaerobic-Nitrate | Succinate-aerobic |
|---|---|---|---|---|---|---|
| 5291(64%) | 4440 (54%) |
4951(61%) | 4533 (56%) |
4476 (55%) |
2681 (33%) |
1736 (21%) |
Over 65% (5253) of core models required two or fewer gapfilling reactions to produce all of the required biomass precursors.
| Number of Models |
Number of Gapfilled reactions or range |
Percentage (%) |
|---|---|---|
| 3415 | 0 | 41 |
| 1270 | 1 | 15 |
| 568 | 2 | 6 |
| 1336 | 3 to 5 |
16 |
| 1448 | 6 to 10 |
14 |
| 317 | 11 to 20 |
4 |
| 16 | 21 to 33 |
0.001 |
This study revealed gaps in our knowledge of the central pathways that result in 2,495 (30%) CMMs being unable to produce ATP under any of the tested conditions. We then established a methodology for the systematic identification and correction of inconsistent annotations using core metabolic models coupled with phylogenetic analysis.
We predict accurate energy yields based on our improved annotations in energy biosynthesis pathways and the implementation of diverse ETC reactions across the microbial tree of life. We highlighted missing annotations that were essential to energy biosynthesis in our models. We examine the diversity of these pathways across all microbial life and enable the scientific community to explore the analyses generated from this large-scale analysis of over 8000 microbial genomes.
In this Narrative we demonstrate construction of core models from the core template, gapfill analysis and flux balance analysis against media formulations.
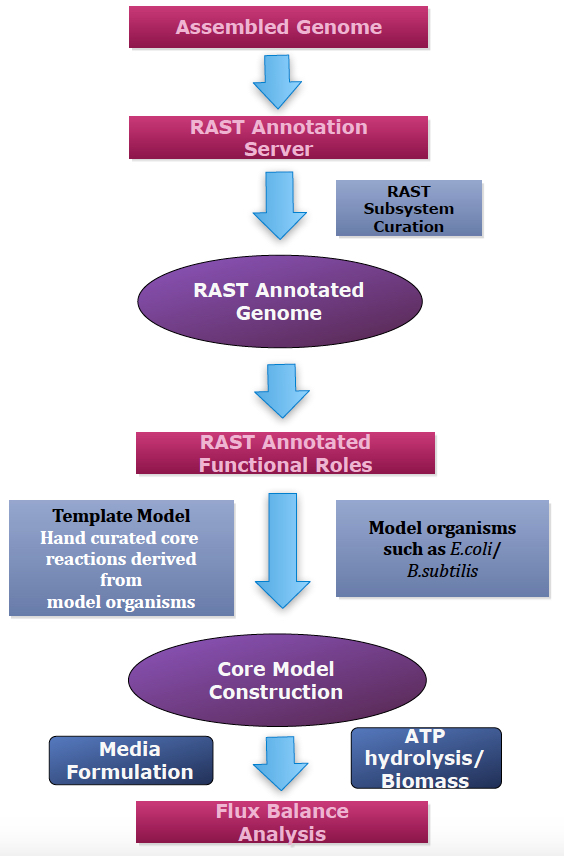
The pipeline starts by assigning gene annotations to the assembled microbial genomes, using the RAST annotation pipeline. Next, the CMMs are constructed based on a manually curated CMT that consists of biochemical reactions derived from a phylogenetically diverse set of model organisms including Escherichia coli, Bacillus. subtilis, Pseudomonas aeroginosa, Clostridium acetobutylicum, and Paracococcus denitrificans. In the final step, FBA is performed, optimizing the biomass or ATP hydrolysis as the objective function.
Figure 1. Core model construction pipeline
Above, the Escherichia coli K12 genome is shown in a genome viewer. This viewer provides a concise, text-based overview of the genome as well as its contigs and genes.
In the Contigs and Genes tabs, each entry is clickable, opening either a browser for the contig or another tab with expanded information about the gene.
You can sort these entries by clicking on a column header to sort by that field (e.g., Length). Clicking the same column header again will reverse the sort order.
This Escherichia coli genome is faily complete and has a single contig: click on the contig to see neighboring genes and potential operons in this species.
To further explore this genome, click the genome name at the top of the viewer. This will open a Landing Page for the genome in a new tab in your browser. The Landing Page provides more details about the organism, its genome, and annotations.
Metabolic models generally require an objective function (OF) that is optimized during flux balance analysis to predict flux profiles. However, in our Core Metabolic Models, we explored two OFs: a biomass biosynthesis objective function and an ATP hydrolysis objective function. While CMMs do not include the amino acids, nucleotides, lipids, and cofactors that are typically included in the biomass biosynthesis objective function of genome-scale models, they do include the central carbon precursor metabolites for these compounds. Thus the biomass biosynthesis OF for our CMMs was constructed based on the biomass precursor stoichiometry derived by Varma and Parlsson and used in one of the earliest models of E. coli. When analyzing CMMs using the biomass biosynthesis OF, we found that occasionally gapfilling was required to enable synthesis of all essential biomass precursors . To permit a focused study of energy biosynthesis in our models without gapfilling, we developed a second OF for our CMMs consisting only of the ATP hydrolysis reaction: ATP + H2O -> ADP + Pi + H+. Using this OF, we computed ATP production yields in all models without any gapfilling; hence, these computations were based solely on reactions derived from existing RAST annotations
First, we will use the Build Metabolic Model app to build an initial draft metabolic core model based on the gene annotations in the Escherichia coli K12 genome. We chose Core metabolism as the model template listed under the field Template for reconstruction. This app has two steps; when the first step (Build Metabolic Model) finishes, the second step (Gapfill Metabolic Model) starts automatically.
The gapfill step lets you specify a media condition (i.e., the metabolites available in the environment in which you want to analyze your organism’s growth). If you leave the Media field blank, "complete" media will be used by default. Complete media is a special type of media that does not include an exact list of compounds. Instead, complete media consists of all metabolites for which a transporter is available in the KBase biochemistry database. (Transporters are reactions that move metabolites across cell membranes.) In the case of core models we use a minimal media for our simulations (e.g., Glucose minimimal media or Glycerol minimal media).
In addition to the media formulations available in KBase, you can upload your own custom media. In this example, Escherichia coli K12 was tested for growth in a minimal media condition called Glucose-aerobic.
We are making a preliminary assertion that a model cannot make all required biomass components from the sources in the minimal media, however, core models are desigined based on highly curated template that many of the core models inculding the one based on Escherichia coli K12 does not require any gapfilling reactions added to the model (see Table 2) in order to proudce its biomass when using Glucose minimal media as the sole carbon source.
Below, you will see the input cells for running the Build Metabolic Model app on our annotated E. coli genome.

An initial draft model of _Model of Escherichia coli K12 is produced based on RAST annotations. The model was not gapfilled, as the gapfilling option was not selected.
Above is the core model for Escherichia coli K12.
There are seven tabs for browsing the data in the model: Overview, Reactions, Compounds, Genes, Compartments, Biomass, Gapfilling and Pathways. The contents of these tabs are as follows:
We have built a core metabolic model; now we can use the Run Flux Balance Analysis app to perform FBA to calculate the flow of metabolites through our model. FBA results can be used to predict the growth rate of an organism under certain conditions or the production rates for particular metabolites of interest. In this case we have used ATP hydrolysis (ATP+H2O -> ADP +Pi + H+) as the objective function.
To perform FBA, you must specify a media condition that you want to investigate using your metabolic model. In this example, we select the Glucose-aerobic minimal media, implying the organism grows on Glucose minimal media under aerobic conditions.

Flux balance analyis resutls (below) are organized into a table with six tabs: Overview, Reaction fluxes, Exchange fluxes, Genes, Biomass, and Pathways. You can see the objective value as 26.5 mmol of ATP/mmol of Glucose. We get this ATP yield as the organism undergoes oxidative phosphorylation by utilizing aerobic electron transport chains. Under the aerobic condition, glucose is fully oxidized into CO2, H2O and energy.
For more information on the Run Flux Balance Analysis app, see:
- Narrative tutorial on metabolic modeling
- App details page, which includes an explanation of all parameters
- Metabolic modeling FAQ
We now run FBA on Ecoli_Glucose using Glucose minimal media under anaerobic conditions (without the presense of oxygen). We select the Glucose-anaerobic media formulation.
Notice the objective value is now 2.75 mmol of ATP/mmol of glucose when simulated under the anaerobic condition. Compared to the objective value 26.5 mmol of ATP/mmol of glucose under the aerobic condition, it is significantly less. This is because there is no oxygen present in the media. As a result, oxidative phosphorylation is not active, electron transport chains are not utilized to produce energy. Under this condition, the organism produces energy solely from the fermentation process.
Facultative anerobic organisms like Escherichia coli can grow both in aerobic and anaerobic conditons, as shown before. They are able to reduce a number of anaerobic electron acceptors such as nitrate (NO3), dimethyl solfuxide (DMSO) and trimethyl amineoxide (TMAO) during anerobic respiration. If anaerobic electron acceptors are not present in the medium, these organisms are still able to grow solely using the fermentation process (as shown above). Now we run FBA on our model 'Ecoli_Glucose' anerobically with nitrate (NO3) present as an anaerobic electron acceptor.
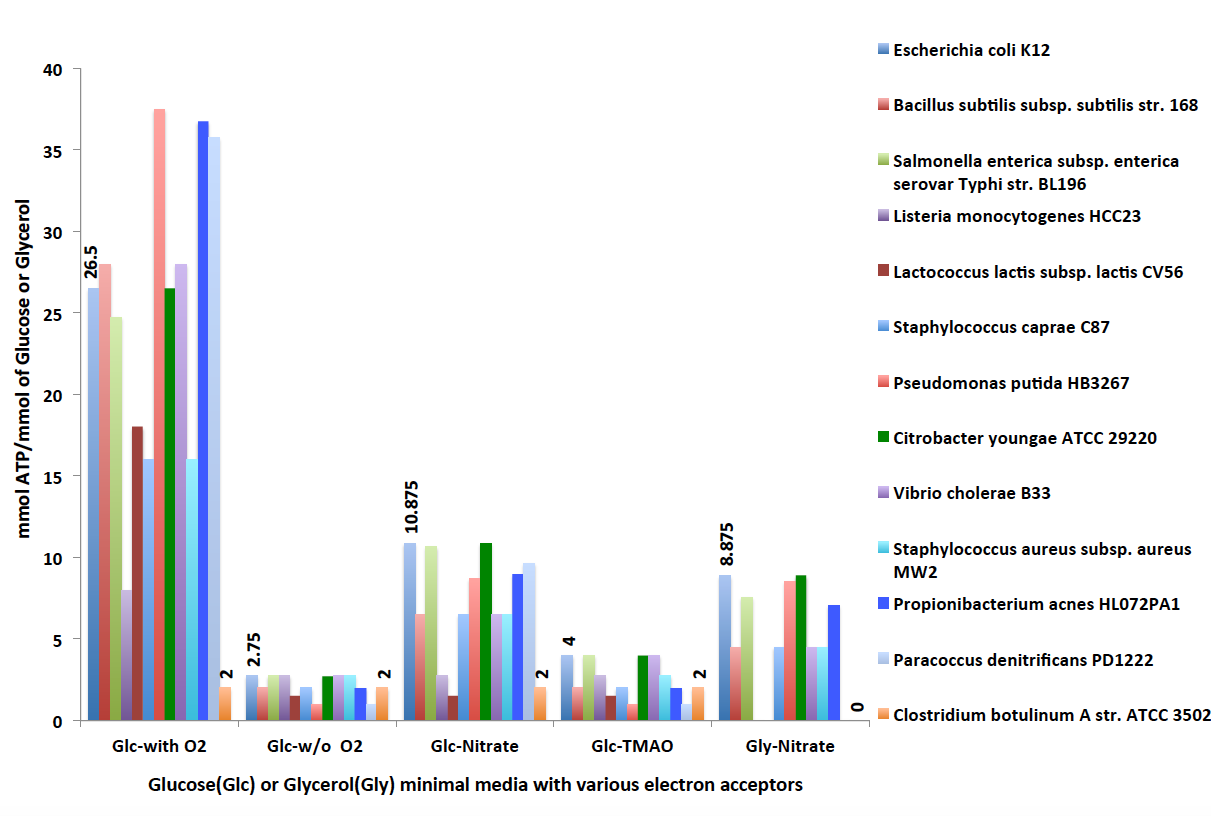
Figure 2. Predictions of ATP yields using FBA on selected core models
As explained earlier, Core Models have two objective functions, ATP hydrolysis and biomass biosynthesis. About 41% of core models (3415), including the core model of Escherichia coli, do not need any gapfilling reactions addedd in order to produce the essential biomass precursors in the OF. However, some core models (see Table 1) require gapfilling reactions to be added in order to satisfy the biomass objective function. Now we run FBA, selecting biomass (bio2) as the objective function against glucose minimal media without the gapfilling option. Return to Narrative contents
We can see the Escherichia coli core model was able to grow (0.12 objective value) without any gapfilling reactions added to the model. However, as some models do require gapfilling in order to produce biomass precursors, we have run an analysis identifying the distribution of number of gapfilling reactions needed by each model and organized them by phylogeny.
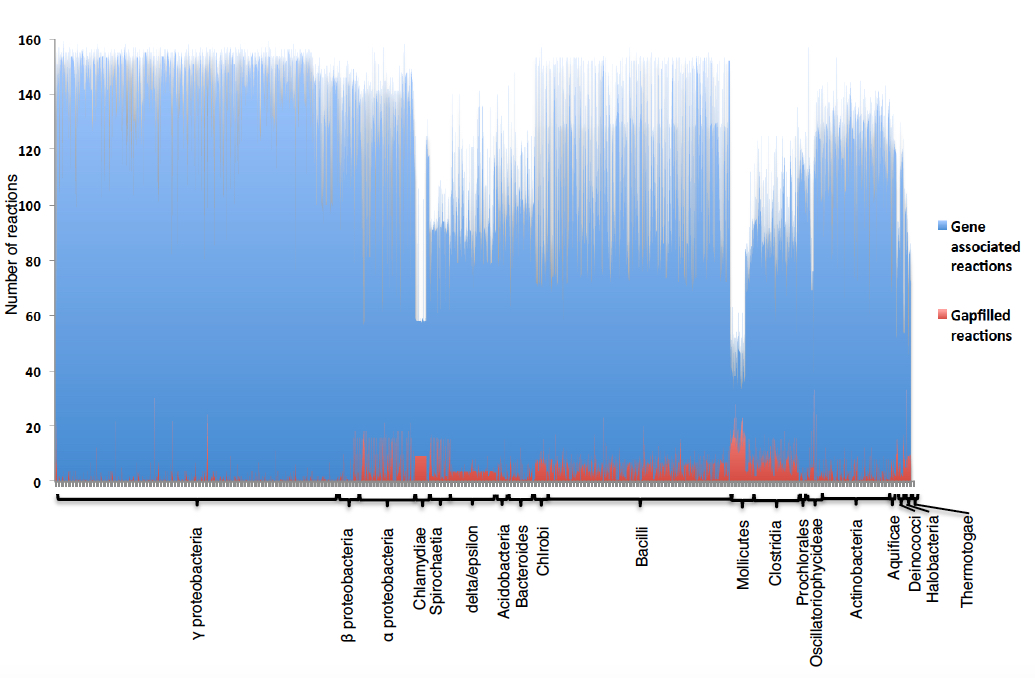
Figure 3. Number of gapfilled reactions that are required in CMMs in order to produce all biomass precursors, with CMMS organized by phylogenetic group. The blue bars represent the gene-associated reactions and the red bars represent the gapfilled reactions for all CMMs used in this study. The height of the bars represents the number of reactions. CMMs are grouped according to taxonomy.