Stephen Nayfach1, Simon Roux1, Rekha Seshadri1, Daniel Udwary1, Neha Varghese1, Frederik Schulz1, Dongying Wu1, David Paez-Espino1, I-Min Chen1, Marcel Huntemann1, Krishna Palaniappan1, Joshua Ladau1, Supratim Mukherjee1, T.B.K. Reddy1, Torben Nielsen1, Edward Kirton1, José P. Faria2, Janaka N. Edirisinghe2, Christopher S. Henry2, Sean P. Jungbluth3, Dylan Chivian3, Paramvir Dehal3, Elisha M. Wood-Charlson3, Adam P. Arkin3, Susannah Tringe1, Axel Visel1, IMG/M Data Consortium, Tanja Woyke1, Nigel J. Mouncey1, Natalia N. Ivanova1, Nikos C. Kyrpides1, Emiley A. Eloe-Fadrosh1
1 DOE Joint Genome Institute, Berkeley, California, USA; 2 Argonne National Laboratory, Argonne, Illinois, USA; 3 Lawrence Berkeley National Laboratory, Berkeley, California, USA
The reconstruction of bacterial and archaeal genomes from shotgun metagenomes has enabled unprecedented insights into the ecology and evolution of environmental and host-associated microbiomes. Here we applied this powerful approach to over 10,000 metagenomes collected from diverse habitats covering all of Earth’s continents and oceans, human- and animal-host associated microbiomes, engineered environments, and natural and agricultural soils to capture extant microbial metabolic and functional potential. We present a comprehensive catalogue of 52,515 metagenome-assembled genomes representing 12,556 novel candidate species-level operational taxonomic units (OTUs), spanning 135 phyla, which expand the known phylogenetic diversity of Bacteria and Archaea by 44%. We also demonstrate the utility of this collection for secondary metabolite biosynthetic potential and predicting host-virus linkage, which can provide a view into the global distribution of lysogenic viruses. This resource underscores the value of leveraging genome-centric approaches to reveal genomic properties of uncultivated microbes that impact on ecosystem processes.
Genome-scale metabolic models
All metabolic models were built and reconstructed using the “Build Metabolic Model” App in KBase. GEMs and reference genomes were annotated with RAST [5] in KBase, as the ModelSEED [6] pipeline uses RAST functional roles to map genes to biochemical reactions [1,2]. The metabolic models were used to assess pathway presence (as defined by KEGG [3]) as detected by a complete flux pathway within the defined environments. A pathway was determined present or not detected by computing the number of gene-associated functional reactions (GAFRs) in each pathway across all models. GAFRs are defined as reactions in a model that are involved in pathways that offer uninterrupted mass-balanced routes from nutrients to biomass and byproducts. Thus, GAFRs exclude reactions that are part of fragmentary, incomplete, and likely nonfunctional pathways.
The GEMs were expected to have some gaps due to incomplete genome reconstruction, and gaps will occur due to errors and omissions in functional annotations. To address these issues, all GEMs were subjected to a gap filling operation [4] that ensured that every highquality GEM was capable of producing biomass from a least one carbon source. Out of the 3,732 high-quality GEMs, we analyzed metabolic models for a subset of 3,270, excluding MAGs with biome labeled as “other” and biomes with low MAG counts (<40 MAGs). Out of the subset of 3,270, 15 did not successfully complete the gap filling operation, resulting in 3,255 GEMs with metabolic models.
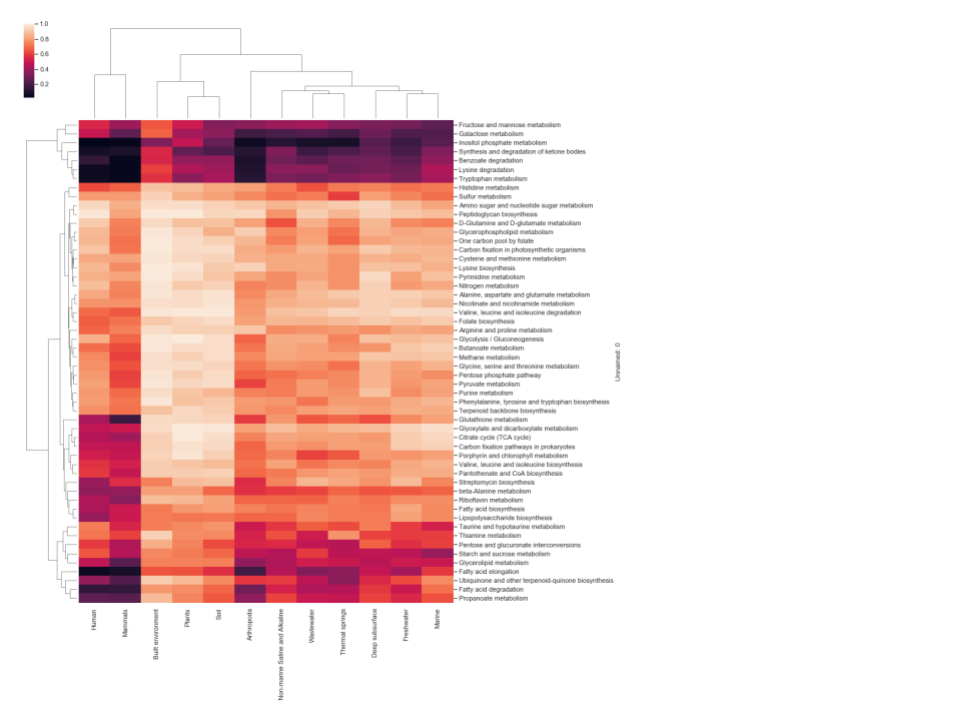
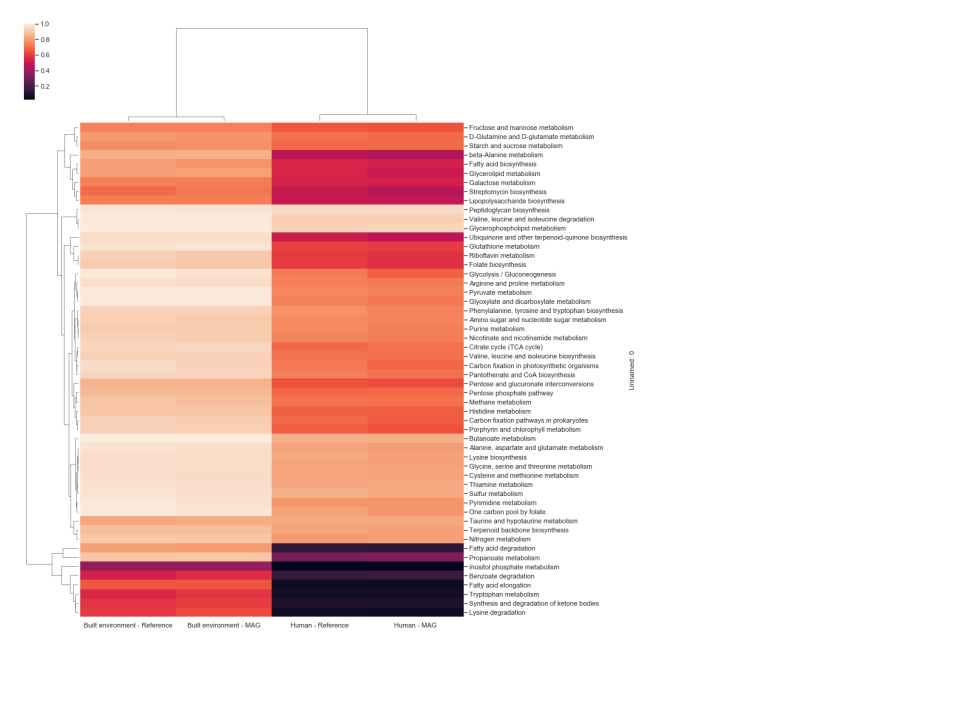
A threshold-based approach was used to define each pathway as being either present or not detected in each GEM and reference genome analyzed. The individual thresholds were assessed by calculating the difference between average and standard deviation of GAFRs for each individual pathway. Pathways above the calculated threshold (GEMs Pathway Table) are considered “present” for a given model/organism. Only pathways with five or more GAFRs were considered in this study to account for smaller linear pathway definitions by KEGG. Based on this analysis, the fraction of GEMs in each environment that were determined to possess active pathways are shown in Figure 1. Three scenarios were detected: (1) pathways effectively present in all genomes in the environment (light color cells); (2) pathways not detected in any genomes (dark color cells); and (3) pathways present in some genomes but not others. This corresponds with pathways that are likely essential, pathways that likely contribute little to fitness, and pathways that may contribute to potential cometabolism and trophic dependency within the microbial community. Differences can also be seen in patterns of pathway presence between environments, although similar environments do cluster together (e.g., human and mammal). To validate the high-quality GEM metabolic models, pathway presence profiles were computed for reference genomes associated with humans and the built environment, as these two environments have >100 GEMs with associated reference genomes (Figure 2). The resulting profiles were nearly identical for all pathways. Pearson correlation coefficients were calculated for each GEM and corresponding reference genome across 55 metabolic pathways, with an average value >0.98. When the GEM and reference genomes were randomly paired and a Pearson correlation was calculated, the average correlation dropped to ~0.82, indicating that the high correlation previously reflects the similarity of the GEM and reference genome. All data and calculations used in these analyses are available in the GEMs Pathway Table.
DATA AVAILABILITY - requires a KBase login to access
RAST annotated Genomes, Phylogenetic Trees, and Gapfilled FBA Models (for Narratives labeled with * ) were calculated for the High Quality (CheckM completeness >= 90% and contamination <= 5%) Non-Redundant (cluster threshold 95% ANI) MAGs and corresponding proximal RefSeq isolate genomes. Data are available in the JGI MAGs Organization, partitioned by Biome classification, in the following Narratives:
 Figure 1 Hierarchically clustered heatmap of the fraction of GEMs in each environment
that were determined to possess active pathways from genome-scale metabolic 200 models. The
color scheme indicates pathway presence or not detected. Light cells indicate a pathway is
present in all or most all genomes in the environment. Dark cells show environments where
the pathway was not detected in those genomes.
 Figure 2 Hierarchically clustered heatmap of the fraction of GEMs vs close Refseq genome
for the “Built environment” and “Human” biomes, that were determined 210 to possess active
pathways from genome-scale metabolic models. The color scheme indicates pathway
presence or not detected. Light cells indicate a pathway is present in all or most all genomes
in the environment. Dark cells show environments where the pathway was not detected in
those genomes.
REFERENCES