Visualize a network of flux through all reactions in a flux balance analysis (FBA) solution.
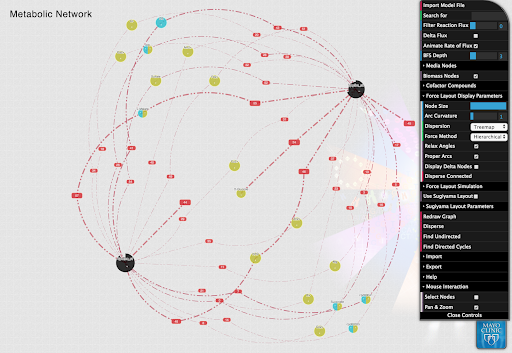
This App generates a network-based view showing how the species represented within a particular metabolic model interact with each other and the environment in a specified flux balance analysis (FBA) solution. This App does not show intracellular flux, but rather only shows exchange fluxes between species and their environment. If the input FBA solution is from a single-species model (non-community model), it will only show what nutrients that individual s species consumes from, and excretes to, the environment. If an FBA solution from a community metabolic model is specified, the App is more useful because it shows how species are potentially interacting. In the output network visualization (illustrated at the top of this detail page): (i) black circles are species; (ii) yellow circles are compounds consumed by the species; (iii) blue circles are compounds produced by the species; (iv) yellow and blue circles are compounds produced by some species and consumed by other species; and (v) red rectangles represent exchange reactions between compounds and each individual species (these may represent multiple distinct transport reactions in the species modes). Note, it is possible to move nodes in the network around to gain a better view at portions of the network.
The default view from the App is less than ideal due to the default settings in the underlying network visualization tool. First, it is highly recommended to click on the View report in separate window button so the network viewer can be seen in full screen. Second, it is suggested to immediately open the settings in the viewer by clicking on the button labeled Open controls in the upper righthand corner of the viewer. In these settings, reduce the setting labeled Filter reaction flux to 0 to make all fluxes appear. Also, click on the checkbox labeled Animate rate of flux . All other controls will not be described here, but for help with these settings, click on the button labeled Help toward the bottom of the open settings panel.
This App leverages a metabolic network visualization tool developed by the Theoretical Biology group at the Mayo Clinic.
For additional information about metabolic modeling, visit the Metabolic Modeling in KBase FAQ.
Team members who developed & deployed algorithm in KBase: Chris Henry and James Jeffryes. For questions, please contact us.
Related Publications
- Arkin AP, Cottingham RW, Henry CS, Harris NL, Stevens RL, Maslov S, et al. KBase: The United States Department of Energy Systems Biology Knowledgebase. Nature Biotechnology. 2018;36: 566. doi: 10.1038/nbt.4163 , https://www.nature.com/articles/nbt.4163
App Specification:
https://github.com/kbaseapps/fba_tools/tree/b083384ac00d4f9d7cb796a664ee3ffd017cf248/ui/narrative/methods/view_flux_networkModule Commit: b083384ac00d4f9d7cb796a664ee3ffd017cf248