Generated February 23, 2020
NOTE: This tutorial is view-only, allowing you to see, but not alter, the input and output of the KBase apps used in this workflow. To run the steps yourself in a new Narrative using your own data or different parameters, copy this Narrative using the "copy" button at the top right. If you just want to read this Narrative (without copying it), you still can see the data objects generated in the workflow by using the “Controls” link at the top left. For more information, please see the Narrative Interface User Guide.
KBase has a suite of tools and data that support the reconstruction, prediction, and design of metabolic networks in microbes. These tools could help advance, for example, efforts to opimize microbial production of a certain biofuel or find the minimal media conditions under which that fuel is generated.
Starting from genome sequence data, this tutorial demonstrates how to use KBase tools to reconstruct and analyze genome-scale metabolic models. These models are primarily reconstructed from protein functional annotations originally derived from literature and subsequently propagated from genome to genome by sequence similarity.
When a genome is functionally annotated, its metabolic genes are mapped onto biochemical reactions. This information is integrated with data about reaction stoichiometry, subcellular localization, biomass composition, estimation of energy requirements (directionality of reactions), and other constraints into a detailed stoichiometric model of metabolism. Metabolic models can be used to evaluate an organism’s metabolic capability by simulating growth under different conditions to answer important biological questions such as:
What biochemical pathways are present?
What are the high flux pathways under a certain growth condition?
Could the organism grow anaerobically?
Would it grow under certain minimal media conditions?
Could the organism be optimized to produce a particular drug molecule or industrially important biofuel?
Video Tutorial: Building Metabolic Models in KBase
See also: Metabolic Modeling FAQ

The Build Metabolic Model app takes a Genome object and a Media object as input. In KBase, a “Genome” or “Genome typed object” is a data object that contains the feature calls and annotation data for a genome. The media condition is a special object type that contains the chemical compounds found in a particular growth medium. There are over 500 different media conditions to choose from in KBase.
You can load annotated genomes into your Narrative from KBase's reference data via the Public tab in the Data Browser slideout or import your own Genome by following the instructions in the Data Upload Download Guide.
The Run Flux Balance Analysis app takes a Metabolic Model (FBA model) object generated by the Build Metabolic Model app in addition to a Media object. In KBase, an Metabolic Model (FBA model) object contains the reactions, compounds, compartments, biomass reactions, and gene associations that comprise a metabolic model. Metabolic Models (FBA models) can be imported in a variety of formats, see the Data Upload and Download Guide for information about how to upload a Metabolic Model (FBA model).
The Simulate Growth on Phenotype Data app takes a Phenotype Set object imported by the user. The Phenotype Set data type represents the experimental data of an organism’s ability to grow on a specific media condition, recorded as either growth or no growth. For information about formatting and uploading a Phenotype Set, see the Data Upload and Download Guide.
The output of this app is an FBAmodel object for the gapfilled Metabolic Model. An FBAmodel object contains the reactions that were found by the metabolic model reconstruction, as well as the gapfilled reactions, if any.
The output of this app is an FBA object that displays in a table-based view the growth of the model, reaction fluxes and associated gene IDs, compound fluxes, and gene knockout data. Biomass compounds and coefficient values also are displayed in the table.
The output of this app is a “PhenotypeSimulationSet,” or a list of the growth phenotypes included in the phenotype set, along with growth rates predicted by the specified metabolic model. In this data object, each phenotype is also classified based on the agreement between the model-predicted growth and the experimentally observed growth. If model growth and experiment growth are both nonzero, this is classified as a correct positive (CP). If the model growth and experiment growth are zero, this is classified as a correct negative (CN).
If the model growth is zero while the experiment growth is nonzero, this is classified as a false negative (FN). If the model growth is nonzero while the experiment growth is zero, this is classified as a false positive (FP). All data from the generated PhenotypeSimulationSet is displayed in tabular form within the Narrative.
To demonstrate KBase's metabolic modeling functionality, this tutorial will use the annotated genome of the MR-1 strain of Shewanella oneidensis, a facultative bacterium capable of surviving in both aerobic and anaerobic conditions.

More than 500 media formulations are available in KBase and accessible to users through the Public tab in the Data Browser (See the Narrative Interface User Guide for information on finding and adding media and other data types to Narratives.)
Draft metabolic models lack a number of essential reactions due to missing or inconsistent annotations. As a result, these models often are unable to produce biomass (i.e., grow). With C-D-Lactate as the sole carbon source, the model in this example should not be able to produce all biomass components. To address this challenge, the KBase gapfilling process will use an algorithm that identifies the minimal set of reactions required to fill the metabolic gaps, thereby enabling the model to produce biomass. Note that gapfilled reactions are assertions based on annotations missed by the standard annotation pipeline, including missed genes that encode these functions.
We will then use the improved gapfilled model to run flux balance analysis (FBA) on the selected minimal media, enabling us to see how well the model grows.
Next, to determine how well our model predicts the growth behavior of the organism, we will test the ability of the model to predict growth on a variety of different media formulations. To do this, we need an experimental dataset that KBase represents as a Phenotype Set, which reports growth of the organism on specific media formulations. Simulation of the model against this phenotypic data validates model predictions or reveals where these predictions disagree with the phenotypic data.
To further improve model predictions with respect to the phenotype dataset, we will then gapfill on several different media conditions for which the organism showed growth. This makes the model more closely resemble the metabolic diversity of the particular organism.
Specific steps covered in this tutorial are:
Although you can upload your own data for analysis, this tutorial will use a public annotated genome (“Shewanella_oneidensis_MR-1”) accessible within KBase. This genome was added to the Narrative by searching for its name under the Public tab of the Data Browser and clicking the “Add” button. Note that you can click the "Controls" link at the top left to see this genome and all other data objects that have been added to or generated in this Narrative.
In KBase, a genome is a special data type that contains the genome sequence as well as gene and feature calls. The S. oneidensis MR-1 genome was run through an annotation pipeline in KBase that generates annotations compatible with the FBA modeling suite used in this workflow. This annotation pipeline is based on RAST and generates feature IDs that are consistent with SEED subsystem naming conventions (see the annotation details page for more information). The FBA tools used in this tutorial are based on ModelSEED, which uses this type of annotation data to associate genes with biochemical reactions and then build an FBA model.
For more information on finding and adding data to your Narrative, please see the Narrative Interface User Guide.
Below, the S. oneidensis MR-1 genome is shown in a genome viewer. This viewer provides a concise, text-based overview of the genome as well as its contigs and genes.
In the Contigs and Features tabs, each entry is clickable, opening either a browser for the contig or another tab with expanded information about the gene. You can sort these entries by clicking on a column header to sort by that field (e.g., Length). Clicking the same column header again will reverse the sort order.
The S. oneidensis MR-1 genome has two contigs: one chromosome and one plasmid. Click on one to see neighboring genes and potential operons in this species.
To further explore this genome, click the genome name next to "KBase Object Name" in the overview table for the genome object. This will open a Landing Page for the genome in a new tab in your browser. The Landing Page provides more details about the organism, its genome, and annotations.

KBase’s toolkit includes apps for metabolic model inference, simulation, comparison, editing, and reconciliation with phenotypic data. This section and those that follow explore some of that functionality.
First, we will use the Build Metabolic Model app to build a gapfilled metabolic model based on the gene annotations in the S. oneidensis MR-1 genome. Gapfilling lets you specify a media condition (i.e., the metabolites available in the environment in which you want to analyze your organism’s growth). If you leave the Media field blank, "complete" media will be used by default. Complete media is a special type of media that does not include an exact list of compounds. Instead, complete media consists of all metabolites for which a transporter is available in the KBase biochemistry database. (Transporters are reactions that move metabolites across cell membranes.)
In addition to the media formulations available in KBase, you can upload your own custom media. In this example, S. oneidensis MR-1 was tested for growth in a minimal media condition called C-D-Lactate.
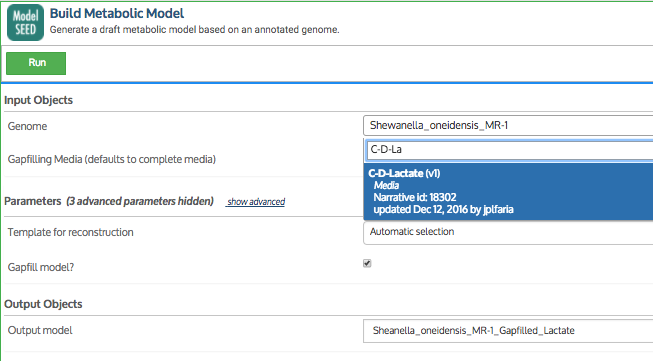
Note: Some app input fields are “smart” and know which data in your Narrative is valid for that field. These smart fields have a pulldown list of data objects that you can choose from. Because we added the C-D-Lactate media to our Narrative, it shows up as an option for the Media input field of this app (see screenshot below).
We chose a minimal media for this initial gapfilling to ensure that the algorithm will add the maximal set of reactions to the genome-inferred model to produce biomass without many common necessary substrates present. We are making a preliminary assertion that Shewanella cannot make all the biomass components from the sources in the minimal media, and the gapfilling process adds all the reactions necessary to produce cell biomass using C-D-Lactate as the sole carbon source.
Below, you will see the input cells for the Build Metabolic Model app. This app first builds a draft metabolic model and then gapfills it on the chosen media. The fields in the input cells are filled in to infer and gapfill on C-D-Lactate media for our S. oneidensis MR-1 genome. Below the input cells, you should see the output that was produced by the app.

| Created Object Name | Type | Description |
|---|---|---|
| Shewanella_oneidensis_MR-1_Gapfilled_Lactate | FBAModel | FBAModel-11 Shewanella_oneidensis_MR-1_Gapfilled_Lactate |
| Shewanella_oneidensis_MR-1_Gapfilled_Lactate.gf.0 | FBA | FBA-13 Shewanella_oneidensis_MR-1_Gapfilled_Lactate.gf.0 |
The output (above) of the Build Metabolic Model app shows information about the resulting gapfilled model. (Note that although the object type is “FBA Model,” we have not actually performed a flux balance analysis yet.)
There are eight tabs for browsing the data in the model: Overview, Reactions, Compounds, Genes, Compartments, Biomass, Gapfilling, and Pathways.
Note that a second object is also produced alongside the metabolic model - a Flux Balance Analysis (FBA) object. We will explain and reproduce the actions required to produce this object in the next step, but know that this is also generated when building the metabolic model.
Once you have built a metabolic model, you can use the Run Flux Balance Analysis app to perform FBA to calculate the flow of metabolites through your model. FBA results can be used to predict the growth rate of an organism under certain conditions or the production rates for particular metabolites of interest.
To perform FBA, you must specify the media conditions that you want to investigate using your metabolic model. In this example, we again select the C-D-Lactate minimal media.

| bio1 |
| Created Object Name | Type | Description |
|---|---|---|
| Shewanella_oneidensis_MR-1_FBA_Lactate | FBA | FBA-13 Shewanella_oneidensis_MR-1_FBA_Lactate |
When the FBA analysis finishes, information on the flux distribution is displayed in a table with six tabs: Overview, Reaction fluxes, Exchange fluxes, Genes, Biomass, and Pathways (see above).
For more information on the Run Flux Balance Analysis app, see:
- App tutorial
- App details page, which includes an explanation of all parameters
- Metabolic modeling FAQ
One valuable use for metabolic models in KBase is the ability to simulate growth phenotypes such as gene essentiality data. These simulations are important for model validation because they enable the comparison of model phenotype predictions with experimental observations. To simulate growth phenotypes, we need an experimental dataset that measures growth of the organism on different media. KBase represents this data as a Phenotype Set.
Phenotype Sets usually are derived from stand-alone growth experiments conducted in a laboratory or based on Biolog plates (Bochner et al. 2001). The growth data in a Phenotype Set is represented as a list of media conditions in which the growth of the organism is recorded as growth (1) or no growth (0), (See Phenotypes tab below).
Simulation of the model against this phenotypic data validates model predictions or reveals where these predictions disagree with the data. To further improve model predictions with respect to the phenotype dataset, we then gapfill on several different media conditions in which the organism showed growth. This process makes the model more closely resemble the metabolic diversity of the particular organism.
In this tutorial, we will use a phenotype dataset called “Shewanella_Phenotype_Set” that was added to the Narrative using the Example tab in the Data Browser. This example phenotype data, shown in the viewer cell below, is based on results from growth experiments. The Phenotypes tab lists the eight media conditions comprising the set and the observed growth/no growth for each condition. Remember that growth or no growth for each condition is indicated by a 1 or 0, respectively, in the "Observed normalized growth" column. You can click on each condition to open a page about that media in a new browser tab.
If you are curious about the formatting of a Phenotype Set input file looks like, see the Data Upload and Download Guide for more information.
Now we run the Simulate Growth on Phenotype Data app, which performs FBA against each media condition in the phenotype dataset and compares the results.
Results are listed as "Observed normalized growth" (experiments done in a laboratory) vs. "Simulated growth" (simulation of FBA on the model). You can see these in the Phenotypes tab of the output cell below.
In the “Prediction class”column, simulated growth results against observed growth are represented in four different classes:

| bio1 |
| Created Object Name | Type | Description |
|---|---|---|
| Shewanella_SimPheno_Set | PhenotypeSimulationSet | PhenotypeSimulationSet-3 Shewanella_SimPheno_Set |
| Shewanella_SimPheno_Set.fba | FBA | FBA-13 Shewanella_SimPheno_Set.fba |
In the output of the Simulate Growth on Phenotype Data app above, we see a number of false negative (FN) results on simulated growth, which means the model is not able to grow on laboratory-tested media conditions. The most likely explanation for a FN prediction is that the model is missing reactions required for viable growth in the specified media conditions (e.g., no asparagine metabolism pathway in a media where asparagine is the only carbon source). This error can be corrected by using gapfilling to add a minimal set of reactions to the model such that growth is permitted.
To optimize the model to match the phenotype data, we will gapfill the model on some of the media conditions listed in the phenotype dataset: C-acetate, C-Butyrate, and LB_4C_24h. After each gapfilling run, we can examine the output to find out more about the gapfilling solutions that were generated. This could also be accomplished within the Simulate Growth on Phenotype Data by checking the "Gapfill to fit data?" box in the Configure tab of the App. But, we will use the Gapfill Metabolic Model app to accomplish this now.
For each gapfilling run, the number of solutions appears last in the Overview tab. For example, there were two gapfill solutions generated and integrated into the gapfilled model “Shewanella_oneidensis_MR-1_GP1.” You can access these solutions by choosing the Gapfilling tab and clicking on the gapfill IDs (gf.1, etc.). The "Integrated" column in that tab tells you whether that solution was integrated into the model. The other tabs in the output are described in Steps 3 and 4, above.

| bio1 |
| Created Object Name | Type | Description |
|---|---|---|
| Shewanella_oneidensis_MR-1_GP1 | FBAModel | FBAModel-11 Shewanella_oneidensis_MR-1_GP1 |
| Shewanella_oneidensis_MR-1_GP1.gf.1 | FBA | FBA-13 Shewanella_oneidensis_MR-1_GP1.gf.1 |
| bio1 |
| Created Object Name | Type | Description |
|---|---|---|
| Shewanella_oneidensis_MR-1_GP2 | FBAModel | FBAModel-11 Shewanella_oneidensis_MR-1_GP2 |
| Shewanella_oneidensis_MR-1_GP2.gf.2 | FBA | FBA-13 Shewanella_oneidensis_MR-1_GP2.gf.2 |
| bio1 |
| Created Object Name | Type | Description |
|---|---|---|
| Shewanella_oneidensis_MR-1_FinalGapfill | FBAModel | FBAModel-11 Shewanella_oneidensis_MR-1_FinalGapfill |
| Shewanella_oneidensis_MR-1_FinalGapfill.gf.3 | FBA | FBA-13 Shewanella_oneidensis_MR-1_FinalGapfill.gf.3 |
Now the model has been gapfilled on several media formulations to improve model predictions on the laboratory-generated growth conditions. Simulating the growth on this optimized model shows that the predictions are closely reconciling the observed growth. After the reconciliation of the phenotype data, notice that in the Phenotype tab, there are more correct positive (CP) results, indicating improved predictions of the metabolic model.
| bio1 |
| Created Object Name | Type | Description |
|---|---|---|
| Shewanella_SimPheno_Set_Optimized | PhenotypeSimulationSet | PhenotypeSimulationSet-3 Shewanella_SimPheno_Set_Optimized |
| Shewanella_SimPheno_Set_Optimized.fba | FBA | FBA-13 Shewanella_SimPheno_Set_Optimized.fba |
To summarize, we generated a draft metabolic model based on the annotated genome of S. oneidensis MR-1. We improved the quality of this draft model by reconciling it to a set of phenotypic data.
The improved model could be used for simulations and running FBA to address important biological questions such as, "What are the high flux reactions or pathways when using lactate minimal medium (C-D-Lacate) as the media source?" The model also could be used in conjunction with other metabolic models as input to several KBase apps, such as [Compare Two Metabolic Models](http://kbase.us/compare-two-metabolic-models-method/) or [Merge Metabolic Models into Community Model](https://narrative.kbase.us/functional-site/#/narrativestore/method/merge_to_community_model).
In the future, we plan to show an extended workflow that includes importing a transcriptomic dataset, running transcriptomic FBA, reconciling the transcriptomic dataset, and comparing flux distributions based on the transcriptome data.
Bochner, B. R., P. Gadzinski, and E. Panomitros. 2001. “Phenotype MicroArrays for High-Throughput Phenotypic Testing and Assay of Gene Function,” Genome Research 11, 1246–55.
Henry, C. S., M. DeJongh, A. A. Best, P. M. Frybarger, B. Linsay, and R. L. Stevens. 2010. “High-throughput generation, optimization and analysis of genome-scale metabolic models,” Nature Biotechnology 28, 977–82.